Analysis Mode
Analysis inspects what a LUT actually does to colour — independent of any image. The screen is split: a square 3-D cube on the left, a column of charts and a before/after comparison on the right.
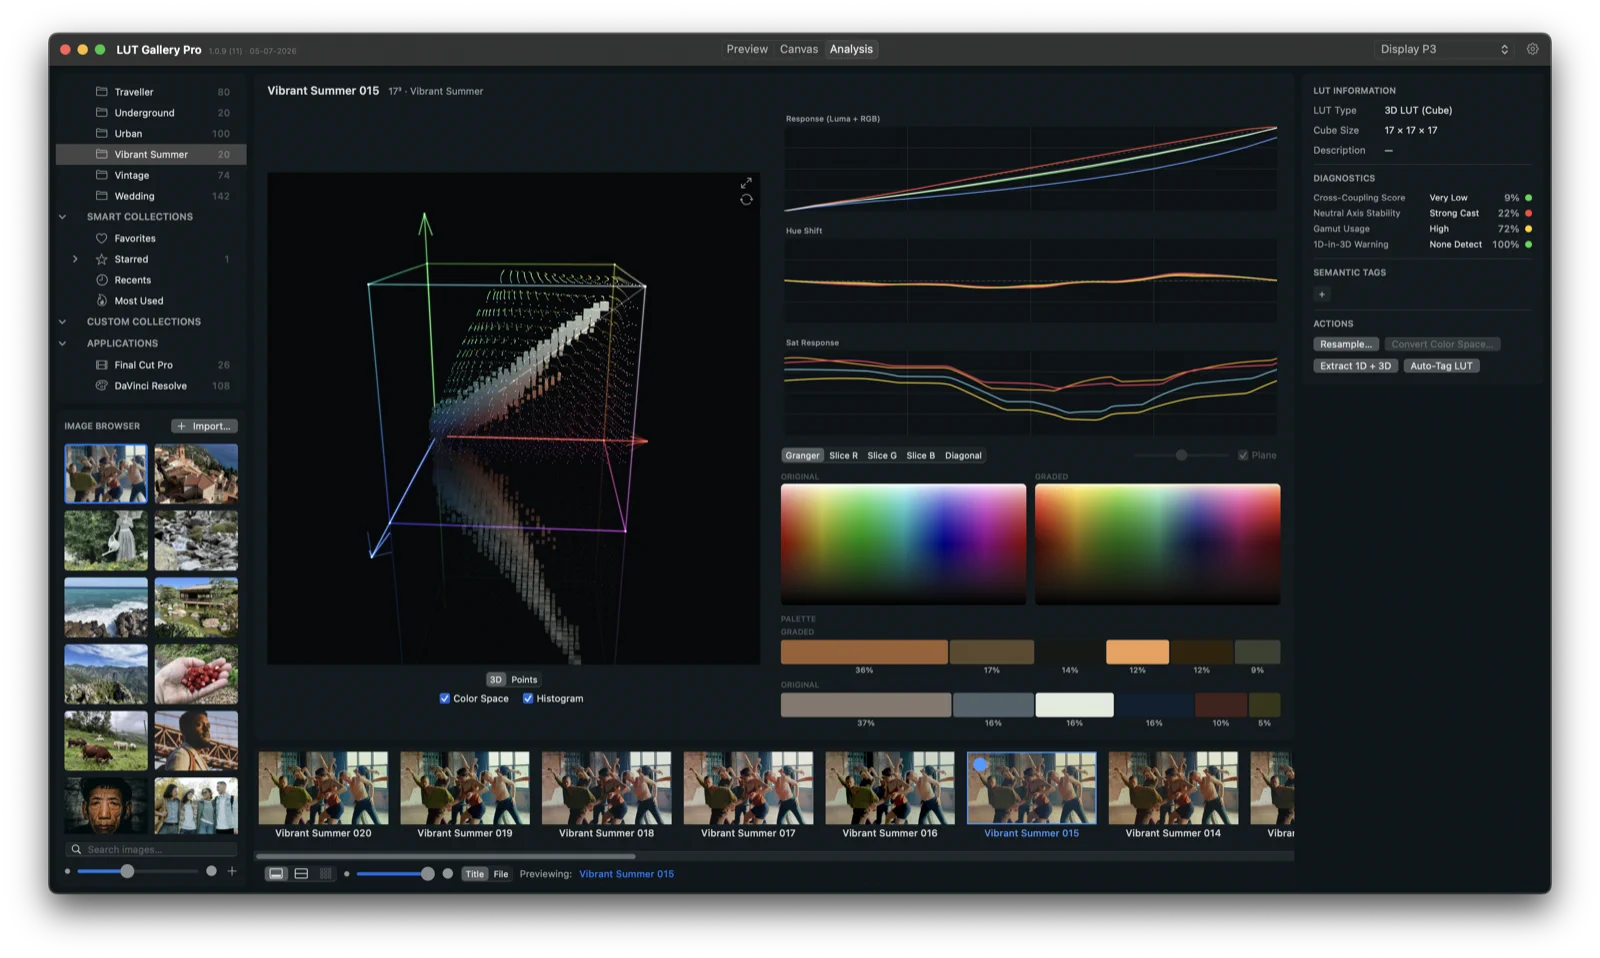
Switch to Analysis from the title bar, then click any LUT in the library/film strip to analyse it (you can also reach it via Analyse in the LUT inspector or the Canvas stack).
note
In Analysis the gallery shows as Filmstrip or Split, so the analysis stays on screen while you pick a LUT — the Full gallery view is disabled here (it would hide the analysis).
The 3-D cube (left)
A live, rotatable plot of the LUT’s transform inside the RGB colour cube — each point is a colour, moved to where the LUT sends it. Neon wireframe, floor reflection and particle cloud make the deformation easy to read.
| Control | What it does |
|---|---|
| 3D / Points | Switch between the wireframe-cube view and a pure point cloud. |
| Rotate (toggle) | Auto-rotate the cube; it also drifts gently when idle. |
| Fit | Reset the view/zoom to frame the cube. |
| Drag | Orbit the cube manually. |
Two checkboxes sit below the cube:
- Color Space — show/hide the LUT itself (its point cloud and displacement vectors). Turn it off to study the histogram alone; the cube frame stays as a reference. On by default.
- Histogram — overlay the current image’s colours as voxels inside the cube (they cast a floor reflection, like the LUT), so you can see which part of the gamut your footage occupies — and therefore which part of the LUT matters.
Show either, both, or neither.
Charts (right)
Three stacked charts read the LUT along whatever pattern you choose:
| Chart | What it tells you |
|---|---|
| Response (Luma + RGB) | Input→output transfer curves for luma and each channel. The diagonal is “no change” — deviations show how the LUT lifts/crushes tones and where channels diverge (colour casts). |
| Hue Shift | How much each input hue is rotated. Flat line = hues preserved; bumps = the LUT pushes certain hues toward others. |
| Sat Response | How saturation in → saturation out maps. Above the line = more saturated, below = desaturated. |
Pattern selector
Chooses which colours are fed through the LUT to build the charts:
- Granger — the classic Granger rainbow test chart (broad hue/sat coverage).
- Slice R / Slice G / Slice B — a 2-D slice through the cube at a fixed level of that channel.
- Diagonal — a plane perpendicular to the neutral (grey) axis, taken at the grey level set by the Level slider.
Level & Plane
| Control | What it does |
|---|---|
| Level (slider) | For slice patterns, sets where the slice is taken. |
| Plane (checkbox) | Draws the slice as a translucent glass plane inside the 3-D cube, so you can see the slice in context. |
(The Color Space and Histogram toggles live under the cube — see above.)
Before / After
Below the charts, ORIGINAL and GRADED thumbnails show the selected test pattern (the same Granger rainbow / cube slice feeding the charts) without and with the LUT, for a quick visual sanity check alongside the numbers.
Palette
Under the before/after pair is a PALETTE readout — the image’s dominant colours pulled straight from the pixels, shown as two strips at once:
- GRADED (top) — the colours after the LUT.
- ORIGINAL (bottom) — the colours before it.
Each swatch’s width is its share of the frame, so the two strips line up as a clean before → after of what the look does to the image’s dominant tones. The palette is chroma-aware, so it surfaces the genuinely distinct colours rather than collapsing to a muddy neutral ramp. (If there’s no graded result, the GRADED strip and its captions hide, leaving a single PALETTE strip.)
Inspector in Analysis
The right Inspector adds LUT-specific cards:
| Card | Contents |
|---|---|
| LUT Information | LUT type (3D cube), cube size, and the LUT’s Description read from its .cube header (# NOTES:/# DESCRIPTION:). A cube doesn’t record its own working space, so there’s no input/output-space guess here. |
| Diagnostics | Automated checks: cross-channel coupling, neutral-axis drift, gamut occupancy, 1-D separability — each with a verdict and a percentage so you can judge LUT quality at a glance. |
| Semantic Tags | Descriptive tags (e.g. warm, teal-orange, high-contrast) — rule-based auto-tag plus your own. |
| Actions | Resample the LUT, extract/convert, auto-tag. |